
Advanced Search: Build a Custom Dashboard
In the fields below, search for indicators by location, topics, population, classification, subgroup, or comparison. No fields are required, but we suggest selecting a location or two to start. In the additional search options section, select options to group and order search results. To learn more about how to customize a dashboard, see our help center.
Visit the Indicator List Page to see the full list of indicators and locations available on the site.
Search Results:
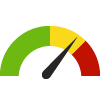
Indicator Gauge Icon Legend
Legend Colors
Red is bad, green is good, blue is not statistically different/neutral.
Compared to Distribution
 the value is in the best half of communities.
 the value is in the 2nd worst quarter of communities.
 the value is in the worst quarter of communities.
Compared to Target
 meets target;
  does not meet target.
Compared to a Single Value
 lower than the comparison value;
 higher than the comparison value;
 not statistically different from comparison value.
Trend

 non-significant change over time;
 significant change over time;
  no change over time.
Compared to Prior Value
 higher than the previous measurement period;
 lower than the previous measurement period;
 no statistically different change from previous measurement period.
Health / Alcohol & Drug Use
Health / Alcohol & Drug Use
Zip Code: 92223
Value
Compared to:
Zip Code: 92223 Adults who Binge Drink: Last 30 Days
Zip Code: 92223 Adults who Binge Drink: Last 30 Days
16.6%
(2021)
Compared to:

CA Zip Codes
The distribution is based on data from 1,730 California zip codes.
U.S. Zip Codes
The distribution is based on data from 31,435 U.S. zip codes.
Riverside, CA County Value
(15.7%)
The regional value is compared to the Riverside County value.
US Value
(15.5%)
The regional value is compared to the national value.
Zip Code: 92223 Age-Adjusted Annual Opioid Prescription Rate
Zip Code: 92223 Age-Adjusted Annual Opioid Prescription Rate
380.2
Prescriptions per 1,000 residents
(2022)
Compared to:
Riverside, CA County Value
(342.2)
The regional value is compared to the Riverside County value.
CA Value
(291.0)
The regional value is compared to the California state value.
Prior Value
(439.8)
Prior Value compares a measured value with the previously measured value. Confidence intervals were taken into account in determining the direction of the comparison.
Trend
This comparison measures the indicator’s values over multiple time periods.<br>The Mann-Kendall Test for Statistical Significance is used to evaluate the trend<br>over 4 to 10 periods of measure, subject to data availability and comparability.
Zip Code: 92223 Age-Adjusted Buprenorphine Prescription Rate
Zip Code: 92223 Age-Adjusted Buprenorphine Prescription Rate
17.9
Prescriptions per 1,000 residents
(2022)
Compared to:


Riverside, CA County Value
(18.5)
The regional value is compared to the Riverside County value.
CA Value
(19.8)
The regional value is compared to the California state value.
Prior Value
(16.1)
Prior Value compares a measured value with the previously measured value. Confidence intervals were taken into account in determining the direction of the comparison.
Trend
This comparison measures the indicator’s values over multiple time periods.<br>The Mann-Kendall Test for Statistical Significance is used to evaluate the trend<br>over 4 to 10 periods of measure, subject to data availability and comparability.
Zip Code: 92223 Opioid Prescription Patients
Zip Code: 92223 Opioid Prescription Patients
3.0%
(Q3 2022)
Compared to:
CA Zip Codes
The distribution is based on data from 1,736 California zip codes.
Riverside, CA County Value
(2.5%)
The regional value is compared to the Riverside County value.
Prior Value
(3.0%)
Prior Value compares a measured value with the previously measured value. Confidence intervals were not taken into account in determining the direction of the comparison.
Trend
This comparison measures the indicator’s values over multiple time periods.<br>The Mann-Kendall Test for Statistical Significance is used to evaluate the trend<br>over 4 to 10 periods of measure, subject to data availability and comparability.
Zip Code: 92223 Quarterly Opioid Prescription Rate
Zip Code: 92223 Quarterly Opioid Prescription Rate
359.5
Prescriptions per 10,000 population
(Q2 2022)
Compared to:

CA Zip Codes
The distribution is based on data from 2,177 California zip codes.
Riverside, CA County Value
(310.8)
The regional value is compared to the Riverside County value.
Prior Value
(358.7)
Prior Value compares a measured value with the previously measured value. Confidence intervals were not taken into account in determining the direction of the comparison.
Trend
This comparison measures the indicator’s values over multiple time periods.<br>The Mann-Kendall Test for Statistical Significance is used to evaluate the trend<br>over 4 to 10 periods of measure, subject to data availability and comparability.
8.4
Residents on >90 MMEs of Opioids per 1,000 residents
(2022)
Compared to:
Riverside, CA County Value
(7.6)
The regional value is compared to the Riverside County value.
CA Value
(6.3)
The regional value is compared to the California state value.
Prior Value
(9.0)
Prior Value compares a measured value with the previously measured value. Confidence intervals were taken into account in determining the direction of the comparison.
Trend
This comparison measures the indicator’s values over multiple time periods.<br>The Mann-Kendall Test for Statistical Significance is used to evaluate the trend<br>over 4 to 10 periods of measure, subject to data availability and comparability.
