
Search for Indicators
Health Equity Dashboard
Indicator Gauge Icon Legend
Legend Colors
Red is bad, green is good, blue is not statistically different/neutral.
Compared to Distribution
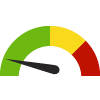 the value is in the best half of communities.
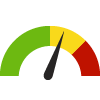 the value is in the 2nd worst quarter of communities.
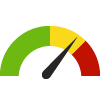
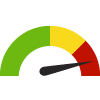 the value is in the worst quarter of communities.
Compared to Target
 meets target;
  does not meet target.
Compared to a Single Value
 lower than the comparison value;
 higher than the comparison value;
 not statistically different from comparison value.
Trend

 non-significant change over time;
 significant change over time;
  no change over time.
Compared to Prior Value
 higher than the previous measurement period;
 lower than the previous measurement period;
 no statistically different change from previous measurement period.
 Significantly better than the overall value
 Significantly worse than the overall value
 Significantly different than the overall value
 No significant difference with the overall value
 No data on significance available
County: Riverside
Health / Alcohol & Drug Use
Value
Compared to:
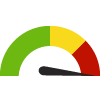
County: Riverside Age-Adjusted Death Rate due to All Opioid Overdose
County: Riverside Age-Adjusted Death Rate due to All Opioid Overdose
23.6
Rate per 100,000 residents
(2022)
Compared to:


CA Counties
The distribution is based on data from 58 California counties.
CA Value
(18.7)
The regional value is compared to the California state value.
Prior Value
(20.4)
Prior Value compares a measured value with the previously measured value. Confidence intervals were not taken into account in determining the direction of the comparison.
Trend
This comparison measures the indicator’s values over multiple time periods.<br>The Mann-Kendall Test for Statistical Significance is used to evaluate the trend<br>over 4 to 10 periods of measure, subject to data availability and comparability.
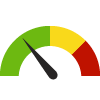
County: Riverside Age-Adjusted Death Rate due to Fentanyl Overdose
County: Riverside Age-Adjusted Death Rate due to Fentanyl Overdose
21.4
(2022)
Compared to:
CA Counties
The distribution is based on data from 58 California counties.
CA Value
(16.6)
The regional value is compared to the California state value.
Prior Value
(17.1)
Prior Value compares a measured value with the previously measured value. Confidence intervals were not taken into account in determining the direction of the comparison.
Trend
This comparison measures the indicator’s values over multiple time periods.<br>The Mann-Kendall Test for Statistical Significance is used to evaluate the trend<br>over 4 to 10 periods of measure, subject to data availability and comparability.
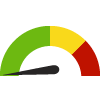
County: Riverside Age-Adjusted Drug and Opioid-Involved Overdose Death Rate
County: Riverside Age-Adjusted Drug and Opioid-Involved Overdose Death Rate
21.1
Deaths per 100,000 population
(2018-2020)
Compared to:
CA Counties
The distribution is based on data from 48 California counties.
U.S. Counties
The distribution is based on data from 1,303 U.S. counties and county equivalents.
CA Value
(16.5)
The regional value is compared to the California state value.
US Value
(23.5)
The regional value is compared to the national value.
Prior Value
(19.8)
Prior Value compares a measured value with the previously measured value. Confidence intervals were taken into account in determining the direction of the comparison.
County: Riverside Age-Adjusted ED Visit Rate due to Heroin Overdose
County: Riverside Age-Adjusted ED Visit Rate due to Heroin Overdose
3.5
Rate per 100,000 residents
(2022)
Compared to:
CA Counties
The distribution is based on data from 58 California counties.
CA Value
(3.6)
The regional value is compared to the California state value.
Prior Value
(1.1)
Prior Value compares a measured value with the previously measured value. Confidence intervals were not taken into account in determining the direction of the comparison.
Trend
This comparison measures the indicator’s values over multiple time periods.<br>The Mann-Kendall Test for Statistical Significance is used to evaluate the trend<br>over 4 to 10 periods of measure, subject to data availability and comparability.
County: Riverside Age-Adjusted ED Visit Rate due to Opioid Overdose (excluding Heroin)
County: Riverside Age-Adjusted ED Visit Rate due to Opioid Overdose (excluding Heroin)
53.5
Rate per 100,000 residents
(2022)
Compared to:
CA Counties
The distribution is based on data from 58 California counties.
CA Value
(54.9)
The regional value is compared to the California state value.
Prior Value
(10.0)
Prior Value compares a measured value with the previously measured value. Confidence intervals were not taken into account in determining the direction of the comparison.
Trend
This comparison measures the indicator’s values over multiple time periods.<br>The Mann-Kendall Test for Statistical Significance is used to evaluate the trend<br>over 4 to 10 periods of measure, subject to data availability and comparability.
County: Riverside Age-Adjusted Hospitalization Rate due to Heroin Overdose
County: Riverside Age-Adjusted Hospitalization Rate due to Heroin Overdose
0.8
Rate per 100,000 residents
(2022)
Compared to:
CA Counties
The distribution is based on data from 58 California counties.
CA Value
(0.7)
The regional value is compared to the California state value.
Prior Value
(1.1)
Prior Value compares a measured value with the previously measured value. Confidence intervals were not taken into account in determining the direction of the comparison.
Trend
This comparison measures the indicator’s values over multiple time periods.<br>The Mann-Kendall Test for Statistical Significance is used to evaluate the trend<br>over 4 to 10 periods of measure, subject to data availability and comparability.
12.0
Rate per 100,000 residents
(2022)
Compared to:

CA Counties
The distribution is based on data from 58 California counties.
CA Value
(12.1)
The regional value is compared to the California state value.
Prior Value
(10.0)
Prior Value compares a measured value with the previously measured value. Confidence intervals were not taken into account in determining the direction of the comparison.
Trend
This comparison measures the indicator’s values over multiple time periods.<br>The Mann-Kendall Test for Statistical Significance is used to evaluate the trend<br>over 4 to 10 periods of measure, subject to data availability and comparability.
County: Riverside Death Rate due to Drug Poisoning
County: Riverside Death Rate due to Drug Poisoning
26.8
Deaths per 100,000 population
(2019-2021)
Compared to:
CA Counties
The distribution is based on data from 54 California counties.
U.S. Counties
The distribution is based on data from 1,899 U.S. counties and county equivalents.
CA Value
(22.0)
The regional value is compared to the California state value.
US Value
(27.2)
The regional value is compared to the national value.
HP 2030 Target
(20.7)
<div>SU-03: Reduce drug overdose deaths <strong>(LEADING HEALTH INDICATOR)</strong></div>
County: Riverside
Health / Cancer
Value
Compared to:
County: Riverside Breast Cancer Incidence Rate
County: Riverside Breast Cancer Incidence Rate
109.9
Cases per 100,000 females
(2016-2020)
Compared to:
CA Counties
The distribution is based on data from 56 California counties.
U.S. Counties
The distribution is based on data from 2,478 U.S. counties and county equivalents.
CA Value
(121.0)
The regional value is compared to the California state value.
US Value
(127.0)
The regional value is compared to the national value.
Prior Value
(112.8)
Prior Value compares a measured value with the previously measured value. Confidence intervals were taken into account in determining the direction of the comparison.
Trend
This comparison measures the indicator’s values over multiple time periods.<br>The Mann-Kendall Test for Statistical Significance is used to evaluate the trend<br>over 4 to 10 periods of measure, subject to data availability and comparability.
County: Riverside Cancer: Medicare Population
County: Riverside Cancer: Medicare Population
12.0%
(2022)
Compared to:
CA Counties
The distribution is based on data from 58 California counties.
U.S. Counties
The distribution is based on data from 3,129 U.S. counties and county equivalents.
CA Value
(11.0%)
The regional value is compared to the California state value.
US Value
(12.0%)
The regional value is compared to the national value.
Prior Value
(12.0%)
Prior Value compares a measured value with the previously measured value. Confidence intervals were not taken into account in determining the direction of the comparison.
Trend
This comparison measures the indicator’s values over multiple time periods.<br>The Mann-Kendall Test for Statistical Significance is used to evaluate the trend<br>over 4 to 10 periods of measure, subject to data availability and comparability.
County: Riverside Cervical Cancer Incidence Rate
County: Riverside Cervical Cancer Incidence Rate
7.9
Cases per 100,000 females
(2016-2020)
Compared to:
CA Counties
The distribution is based on data from 40 California counties.
U.S. Counties
The distribution is based on data from 696 U.S. counties and county equivalents.
CA Value
(7.3)
The regional value is compared to the California state value.
US Value
(7.5)
The regional value is compared to the national value.
Prior Value
(7.8)
Prior Value compares a measured value with the previously measured value. Confidence intervals were taken into account in determining the direction of the comparison.
Trend
This comparison measures the indicator’s values over multiple time periods.<br>The Mann-Kendall Test for Statistical Significance is used to evaluate the trend<br>over 4 to 10 periods of measure, subject to data availability and comparability.
County: Riverside Colorectal Cancer Incidence Rate
County: Riverside Colorectal Cancer Incidence Rate
34.3
Cases per 100,000 population
(2016-2020)
Compared to:
CA Counties
The distribution is based on data from 56 California counties.
U.S. Counties
The distribution is based on data from 2,401 U.S. counties and county equivalents.
CA Value
(33.5)
The regional value is compared to the California state value.
US Value
(36.5)
The regional value is compared to the national value.
Prior Value
(35.6)
Prior Value compares a measured value with the previously measured value. Confidence intervals were taken into account in determining the direction of the comparison.
Trend
This comparison measures the indicator’s values over multiple time periods.<br>The Mann-Kendall Test for Statistical Significance is used to evaluate the trend<br>over 4 to 10 periods of measure, subject to data availability and comparability.
County: Riverside Lung and Bronchus Cancer Incidence Rate
County: Riverside Lung and Bronchus Cancer Incidence Rate
37.4
Cases per 100,000 population
(2016-2020)
Compared to:
CA Counties
The distribution is based on data from 55 California counties.
U.S. Counties
The distribution is based on data from 2,471 U.S. counties and county equivalents.
CA Value
(37.6)
The regional value is compared to the California state value.
US Value
(54.0)
The regional value is compared to the national value.
Prior Value
(40.0)
Prior Value compares a measured value with the previously measured value. Confidence intervals were taken into account in determining the direction of the comparison.
Trend
This comparison measures the indicator’s values over multiple time periods.<br>The Mann-Kendall Test for Statistical Significance is used to evaluate the trend<br>over 4 to 10 periods of measure, subject to data availability and comparability.
County: Riverside Mammography Screening: Medicare Population
County: Riverside Mammography Screening: Medicare Population
39.0%
(2022)
Compared to:

CA Counties
The distribution is based on data from 58 California counties.
U.S. Counties
The distribution is based on data from 3,123 U.S. counties and county equivalents.
CA Value
(41.0%)
The regional value is compared to the California state value.
US Value
(47.0%)
The regional value is compared to the national value.
Prior Value
(39.0%)
Prior Value compares a measured value with the previously measured value. Confidence intervals were not taken into account in determining the direction of the comparison.
Trend
This comparison measures the indicator’s values over multiple time periods.<br>The Mann-Kendall Test for Statistical Significance is used to evaluate the trend<br>over 4 to 10 periods of measure, subject to data availability and comparability.
County: Riverside Oral Cavity and Pharynx Cancer Incidence Rate
County: Riverside Oral Cavity and Pharynx Cancer Incidence Rate
10.2
Cases per 100,000 population
(2016-2020)
Compared to:
CA Counties
The distribution is based on data from 54 California counties.
U.S. Counties
The distribution is based on data from 1,706 U.S. counties and county equivalents.
CA Value
(10.1)
The regional value is compared to the California state value.
US Value
(11.9)
The regional value is compared to the national value.
Prior Value
(10.0)
Prior Value compares a measured value with the previously measured value. Confidence intervals were taken into account in determining the direction of the comparison.
Trend
This comparison measures the indicator’s values over multiple time periods.<br>The Mann-Kendall Test for Statistical Significance is used to evaluate the trend<br>over 4 to 10 periods of measure, subject to data availability and comparability.
County: Riverside Prostate Cancer Incidence Rate
County: Riverside Prostate Cancer Incidence Rate
96.6
Cases per 100,000 males
(2016-2020)
Compared to:
CA Counties
The distribution is based on data from 57 California counties.
U.S. Counties
The distribution is based on data from 2,500 U.S. counties and county equivalents.
CA Value
(95.4)
The regional value is compared to the California state value.
US Value
(110.5)
The regional value is compared to the national value.
Prior Value
(100.4)
Prior Value compares a measured value with the previously measured value. Confidence intervals were taken into account in determining the direction of the comparison.
Trend
This comparison measures the indicator’s values over multiple time periods.<br>The Mann-Kendall Test for Statistical Significance is used to evaluate the trend<br>over 4 to 10 periods of measure, subject to data availability and comparability.
County: Riverside
Health / Diabetes
Value
Compared to:
County: Riverside Adults with Diabetes
County: Riverside Adults with Diabetes
11.9%
(2021-2022)
Compared to:
CA Counties
The distribution is based on data from 58 California counties.
CA Value
(10.7%)
The regional value is compared to the California state value.
US Value
(11.5% in 2022)
The regional value is compared to the national value. The source for the national value is Behavioral Risk Factor Surveillance System
Prior Value
(12.8%)
Prior Value compares a measured value with the previously measured value. Confidence intervals were taken into account in determining the direction of the comparison.
Trend
This comparison measures the indicator’s values over multiple time periods.<br>The Mann-Kendall Test for Statistical Significance is used to evaluate the trend<br>over 4 to 10 periods of measure, subject to data availability and comparability.
County: Riverside Diabetes: Medicare Population
County: Riverside Diabetes: Medicare Population
22.0%
(2022)
Compared to:
CA Counties
The distribution is based on data from 58 California counties.
U.S. Counties
The distribution is based on data from 3,129 U.S. counties and county equivalents.
CA Value
(21.0%)
The regional value is compared to the California state value.
US Value
(24.0%)
The regional value is compared to the national value.
Prior Value
(22.0%)
Prior Value compares a measured value with the previously measured value. Confidence intervals were not taken into account in determining the direction of the comparison.
Trend
This comparison measures the indicator’s values over multiple time periods.<br>The Mann-Kendall Test for Statistical Significance is used to evaluate the trend<br>over 4 to 10 periods of measure, subject to data availability and comparability.
County: Riverside
Health / Disabilities
Value
Compared to:
County: Riverside Adults with Disability
County: Riverside Adults with Disability
29.2%
(2016)
Compared to:


CA Value
(29.7%)
The regional value is compared to the California state value.
US Value
(20.6% in 2015)
The regional value is compared to the national value. The source for the national value is Behavioral Risk Factor Surveillance System
Prior Value
(34.5%)
Prior Value compares a measured value with the previously measured value. Confidence intervals were taken into account in determining the direction of the comparison.
Trend
This comparison measures the indicator’s values over multiple time periods.<br>The Mann-Kendall Test for Statistical Significance is used to evaluate the trend<br>over 4 to 10 periods of measure, subject to data availability and comparability.
County: Riverside Children with a Disability
County: Riverside Children with a Disability
3.9%
(2018-2022)
Compared to:

CA Value
(3.7%)
The regional value is compared to the California state value.
US Value
(4.5%)
The regional value is compared to the national value.
Trend
This comparison measures the indicator’s values over multiple time periods.<br>The Mann-Kendall Test for Statistical Significance is used to evaluate the trend<br>over 4 to 10 periods of measure, subject to data availability and comparability.
County: Riverside Persons with a Cognitive Difficulty
County: Riverside Persons with a Cognitive Difficulty
4.6%
(2018-2022)
Compared to:

CA Value
(4.6%)
The regional value is compared to the California state value.
US Value
(5.3%)
The regional value is compared to the national value.
Trend
This comparison measures the indicator’s values over multiple time periods.<br>The Mann-Kendall Test for Statistical Significance is used to evaluate the trend<br>over 4 to 10 periods of measure, subject to data availability and comparability.
County: Riverside Persons with a Disability
County: Riverside Persons with a Disability
11.6%
(2018-2022)
Compared to:
CA Value
(11.0%)
The regional value is compared to the California state value.
US Value
(12.9%)
The regional value is compared to the national value.
Trend
This comparison measures the indicator’s values over multiple time periods.<br>The Mann-Kendall Test for Statistical Significance is used to evaluate the trend<br>over 4 to 10 periods of measure, subject to data availability and comparability.
County: Riverside Persons with a Hearing Difficulty
County: Riverside Persons with a Hearing Difficulty
3.3%
(2018-2022)
Compared to:
CA Value
(2.9%)
The regional value is compared to the California state value.
US Value
(3.6%)
The regional value is compared to the national value.
Trend
This comparison measures the indicator’s values over multiple time periods.<br>The Mann-Kendall Test for Statistical Significance is used to evaluate the trend<br>over 4 to 10 periods of measure, subject to data availability and comparability.
County: Riverside Persons with a Self-Care Difficulty
County: Riverside Persons with a Self-Care Difficulty
2.8%
(2018-2022)
Compared to:
CA Value
(2.7%)
The regional value is compared to the California state value.
US Value
(2.6%)
The regional value is compared to the national value.
Trend
This comparison measures the indicator’s values over multiple time periods.<br>The Mann-Kendall Test for Statistical Significance is used to evaluate the trend<br>over 4 to 10 periods of measure, subject to data availability and comparability.
County: Riverside Persons with a Vision Difficulty
County: Riverside Persons with a Vision Difficulty
2.3%
(2018-2022)
Compared to:
CA Value
(2.1%)
The regional value is compared to the California state value.
US Value
(2.4%)
The regional value is compared to the national value.
Trend
This comparison measures the indicator’s values over multiple time periods.<br>The Mann-Kendall Test for Statistical Significance is used to evaluate the trend<br>over 4 to 10 periods of measure, subject to data availability and comparability.
County: Riverside Persons with an Ambulatory Difficulty
County: Riverside Persons with an Ambulatory Difficulty
6.3%
(2018-2022)
Compared to:
CA Value
(5.8%)
The regional value is compared to the California state value.
US Value
(6.7%)
The regional value is compared to the national value.
Trend
This comparison measures the indicator’s values over multiple time periods.<br>The Mann-Kendall Test for Statistical Significance is used to evaluate the trend<br>over 4 to 10 periods of measure, subject to data availability and comparability.
County: Riverside
Health / Family Planning
Value
Compared to:
County: Riverside Teen Birth Rate: 15-19
County: Riverside Teen Birth Rate: 15-19
11.5
Live births per 1,000 females aged 15-19
(2019-2021)
Compared to:
CA Counties
The distribution is based on data from 55 California counties.
CA Value
(10.3)
The regional value is compared to the California state value.
US Value
(15.2)
The regional value is compared to the national value. The source for the national value is Centers for Disease Control and Prevention, National Center for Health Statistics
Prior Value
(13.0)
Prior Value compares a measured value with the previously measured value. Confidence intervals were taken into account in determining the direction of the comparison.
Trend
This comparison measures the indicator’s values over multiple time periods.<br>The Mann-Kendall Test for Statistical Significance is used to evaluate the trend<br>over 4 to 10 periods of measure, subject to data availability and comparability.
County: Riverside
Health / Health Care Access & Quality
Value
Compared to:
County: Riverside Adults with Health Insurance: 18-64
County: Riverside Adults with Health Insurance: 18-64
90.5%
(2020-2022)
Compared to:
CA Counties
The distribution is based on data from 58 California counties.
CA Value
(91.2%)
The regional value is compared to the California state value.
Prior Value
(92.3%)
Prior Value compares a measured value with the previously measured value. Confidence intervals were taken into account in determining the direction of the comparison.
Trend
This comparison measures the indicator’s values over multiple time periods.<br>The Mann-Kendall Test for Statistical Significance is used to evaluate the trend<br>over 4 to 10 periods of measure, subject to data availability and comparability.
County: Riverside Children with Health Insurance
County: Riverside Children with Health Insurance
96.2%
(2022)
Compared to:
CA Counties
The distribution is based on data from 42 California counties.
U.S. Counties
The distribution is based on data from 828 U.S. counties and county equivalents.
CA Value
(96.8%)
The regional value is compared to the California state value.
US Value
(94.9%)
The regional value is compared to the national value.
Prior Value
(96.1%)
Prior Value compares a measured value with the previously measured value. Confidence intervals were taken into account in determining the direction of the comparison.
Trend
This comparison measures the indicator’s values over multiple time periods.<br>The Mann-Kendall Test for Statistical Significance is used to evaluate the trend<br>over 4 to 10 periods of measure, subject to data availability and comparability.
County: Riverside People Delayed or had Difficulty Obtaining Care
County: Riverside People Delayed or had Difficulty Obtaining Care
17.0%
(2021-2022)
Compared to:
CA Counties
The distribution is based on data from 58 California counties.
CA Value
(16.5%)
The regional value is compared to the California state value.
Prior Value
(18.8%)
Prior Value compares a measured value with the previously measured value. Confidence intervals were taken into account in determining the direction of the comparison.
Trend
This comparison measures the indicator’s values over multiple time periods.<br>The Mann-Kendall Test for Statistical Significance is used to evaluate the trend<br>over 4 to 10 periods of measure, subject to data availability and comparability.
HP 2030 Target
(5.9%)
County: Riverside Persons with Health Insurance
County: Riverside Persons with Health Insurance
90.8%
(2021)
Compared to:

CA Counties
The distribution is based on data from 58 California counties.
U.S. Counties
The distribution is based on data from 3,140 U.S. counties and county equivalents.
CA Value
(91.9%)
The regional value is compared to the California state value.
Prior Value
(90.5%)
Prior Value compares a measured value with the previously measured value. Confidence intervals were taken into account in determining the direction of the comparison.
Trend
This comparison measures the indicator’s values over multiple time periods.<br>The Mann-Kendall Test for Statistical Significance is used to evaluate the trend<br>over 4 to 10 periods of measure, subject to data availability and comparability.
HP 2030 Target
(92.4%)
<div>AHS-01: Increase the proportion of people with health insurance <strong>(LEADING HEALTH INDICATOR)</strong></div>
County: Riverside Persons with Private Health Insurance Only
County: Riverside Persons with Private Health Insurance Only
49.3%
(2022)
Compared to:

CA Value
(53.5%)
The regional value is compared to the California state value.
US Value
(54.8%)
The regional value is compared to the national value.
Prior Value
(49.6%)
Prior Value compares a measured value with the previously measured value. Confidence intervals were not taken into account in determining the direction of the comparison.
Trend
This comparison measures the indicator’s values over multiple time periods.<br>The Mann-Kendall Test for Statistical Significance is used to evaluate the trend<br>over 4 to 10 periods of measure, subject to data availability and comparability.
County: Riverside Persons with Public Health Insurance Only
County: Riverside Persons with Public Health Insurance Only
33.7%
(2022)
Compared to:

CA Value
(29.8%)
The regional value is compared to the California state value.
US Value
(24.8%)
The regional value is compared to the national value.
Prior Value
(32.4%)
Prior Value compares a measured value with the previously measured value. Confidence intervals were not taken into account in determining the direction of the comparison.
Trend
This comparison measures the indicator’s values over multiple time periods.<br>The Mann-Kendall Test for Statistical Significance is used to evaluate the trend<br>over 4 to 10 periods of measure, subject to data availability and comparability.
County: Riverside Preventable Hospital Stays: Medicare Population
County: Riverside Preventable Hospital Stays: Medicare Population
2,370.0
Discharges per 100,000 Medicare enrollees
(2022)
Compared to:
CA Counties
The distribution is based on data from 58 California counties.
U.S. Counties
The distribution is based on data from 3,129 U.S. counties and county equivalents.
CA Value
(2,275.0)
The regional value is compared to the California state value.
US Value
(2,677.0)
The regional value is compared to the national value.
Prior Value
(2,178.0)
Prior Value compares a measured value with the previously measured value. Confidence intervals were not taken into account in determining the direction of the comparison.
Trend
This comparison measures the indicator’s values over multiple time periods.<br>The Mann-Kendall Test for Statistical Significance is used to evaluate the trend<br>over 4 to 10 periods of measure, subject to data availability and comparability.
County: Riverside
Health / Health Information Technology
Value
Compared to:
County: Riverside Persons with an Internet Subscription
County: Riverside Persons with an Internet Subscription
93.6%
(2018-2022)
Compared to:
CA Counties
The distribution is based on data from 58 California counties.
U.S. Counties
The distribution is based on data from 3,133 U.S. counties and county equivalents.
CA Value
(93.4%)
The regional value is compared to the California state value.
US Value
(91.0%)
The regional value is compared to the national value.
Trend
This comparison measures the indicator’s values over multiple time periods.<br>The Mann-Kendall Test for Statistical Significance is used to evaluate the trend<br>over 4 to 10 periods of measure, subject to data availability and comparability.
County: Riverside
Health / Heart Disease & Stroke
Value
Compared to:
County: Riverside Age-Adjusted Death Rate due to Heart Attack
County: Riverside Age-Adjusted Death Rate due to Heart Attack
43.3
Deaths per 100,000 population 35+ years
(2020)
Compared to:
CA Counties
The distribution is based on data from 49 California counties.
CA Value
(44.4)
The regional value is compared to the California state value.
Prior Value
(40.2)
Prior Value compares a measured value with the previously measured value. Confidence intervals were not taken into account in determining the direction of the comparison.
Trend
This comparison measures the indicator’s values over multiple time periods.<br>The Mann-Kendall Test for Statistical Significance is used to evaluate the trend<br>over 4 to 10 periods of measure, subject to data availability and comparability.
County: Riverside Age-Adjusted Hospitalization Rate due to Heart Attack
County: Riverside Age-Adjusted Hospitalization Rate due to Heart Attack
25.0
Hospitalizations per 10,000 population 35+ years
(2018)
Compared to:
CA Counties
The distribution is based on data from 56 California counties.
CA Value
(25.5)
The regional value is compared to the California state value.
Prior Value
(25.6)
Prior Value compares a measured value with the previously measured value. Confidence intervals were not taken into account in determining the direction of the comparison.
Trend
This comparison measures the indicator’s values over multiple time periods.<br>The Mann-Kendall Test for Statistical Significance is used to evaluate the trend<br>over 4 to 10 periods of measure, subject to data availability and comparability.
County: Riverside Atrial Fibrillation: Medicare Population
County: Riverside Atrial Fibrillation: Medicare Population
14.0%
(2022)
Compared to:
CA Counties
The distribution is based on data from 58 California counties.
U.S. Counties
The distribution is based on data from 3,129 U.S. counties and county equivalents.
CA Value
(13.0%)
The regional value is compared to the California state value.
US Value
(14.0%)
The regional value is compared to the national value.
Prior Value
(14.0%)
Prior Value compares a measured value with the previously measured value. Confidence intervals were not taken into account in determining the direction of the comparison.
Trend
This comparison measures the indicator’s values over multiple time periods.<br>The Mann-Kendall Test for Statistical Significance is used to evaluate the trend<br>over 4 to 10 periods of measure, subject to data availability and comparability.
County: Riverside Heart Failure: Medicare Population
County: Riverside Heart Failure: Medicare Population
11.0%
(2022)
Compared to:
CA Counties
The distribution is based on data from 58 California counties.
U.S. Counties
The distribution is based on data from 3,129 U.S. counties and county equivalents.
CA Value
(10.0%)
The regional value is compared to the California state value.
US Value
(11.0%)
The regional value is compared to the national value.
Prior Value
(10.0%)
Prior Value compares a measured value with the previously measured value. Confidence intervals were not taken into account in determining the direction of the comparison.
Trend
This comparison measures the indicator’s values over multiple time periods.<br>The Mann-Kendall Test for Statistical Significance is used to evaluate the trend<br>over 4 to 10 periods of measure, subject to data availability and comparability.
County: Riverside High Blood Pressure Prevalence
County: Riverside High Blood Pressure Prevalence
39.1%
(2022)
Compared to:
CA Counties
The distribution is based on data from 58 California counties.
CA Value
(34.8%)
The regional value is compared to the California state value.
US Value
(32.4% in 2021)
The regional value is compared to the national value. The source for the national value is Behavioral Risk Factor Surveillance System
Prior Value
(32.9%)
Prior Value compares a measured value with the previously measured value. Confidence intervals were taken into account in determining the direction of the comparison.
Trend
This comparison measures the indicator’s values over multiple time periods.<br>The Mann-Kendall Test for Statistical Significance is used to evaluate the trend<br>over 4 to 10 periods of measure, subject to data availability and comparability.
HP 2030 Target
(41.9%)
County: Riverside Hyperlipidemia: Medicare Population
County: Riverside Hyperlipidemia: Medicare Population
64.0%
(2022)
Compared to:
CA Counties
The distribution is based on data from 58 California counties.
U.S. Counties
The distribution is based on data from 3,129 U.S. counties and county equivalents.
CA Value
(61.0%)
The regional value is compared to the California state value.
US Value
(65.0%)
The regional value is compared to the national value.
Prior Value
(62.0%)
Prior Value compares a measured value with the previously measured value. Confidence intervals were not taken into account in determining the direction of the comparison.
Trend
This comparison measures the indicator’s values over multiple time periods.<br>The Mann-Kendall Test for Statistical Significance is used to evaluate the trend<br>over 4 to 10 periods of measure, subject to data availability and comparability.
County: Riverside Hypertension: Medicare Population
County: Riverside Hypertension: Medicare Population
61.0%
(2022)
Compared to:
CA Counties
The distribution is based on data from 58 California counties.
U.S. Counties
The distribution is based on data from 3,129 U.S. counties and county equivalents.
CA Value
(58.0%)
The regional value is compared to the California state value.
US Value
(65.0%)
The regional value is compared to the national value.
Prior Value
(60.0%)
Prior Value compares a measured value with the previously measured value. Confidence intervals were not taken into account in determining the direction of the comparison.
Trend
This comparison measures the indicator’s values over multiple time periods.<br>The Mann-Kendall Test for Statistical Significance is used to evaluate the trend<br>over 4 to 10 periods of measure, subject to data availability and comparability.
County: Riverside Ischemic Heart Disease: Medicare Population
County: Riverside Ischemic Heart Disease: Medicare Population
20.0%
(2022)
Compared to:
CA Counties
The distribution is based on data from 58 California counties.
U.S. Counties
The distribution is based on data from 3,129 U.S. counties and county equivalents.
CA Value
(18.0%)
The regional value is compared to the California state value.
US Value
(21.0%)
The regional value is compared to the national value.
Prior Value
(20.0%)
Prior Value compares a measured value with the previously measured value. Confidence intervals were not taken into account in determining the direction of the comparison.
Trend
This comparison measures the indicator’s values over multiple time periods.<br>The Mann-Kendall Test for Statistical Significance is used to evaluate the trend<br>over 4 to 10 periods of measure, subject to data availability and comparability.
County: Riverside Stroke: Medicare Population
County: Riverside Stroke: Medicare Population
5.0%
(2022)
Compared to:
CA Counties
The distribution is based on data from 58 California counties.
U.S. Counties
The distribution is based on data from 3,129 U.S. counties and county equivalents.
CA Value
(5.0%)
The regional value is compared to the California state value.
US Value
(6.0%)
The regional value is compared to the national value.
Prior Value
(5.0%)
Prior Value compares a measured value with the previously measured value. Confidence intervals were not taken into account in determining the direction of the comparison.
Trend
This comparison measures the indicator’s values over multiple time periods.<br>The Mann-Kendall Test for Statistical Significance is used to evaluate the trend<br>over 4 to 10 periods of measure, subject to data availability and comparability.
County: Riverside
Health / Immunizations & Infectious Diseases
Value
Compared to:
County: Riverside Flu Vaccinations: Medicare Population
County: Riverside Flu Vaccinations: Medicare Population
44.0%
(2022)
Compared to:
CA Counties
The distribution is based on data from 58 California counties.
U.S. Counties
The distribution is based on data from 3,129 U.S. counties and county equivalents.
CA Value
(48.0%)
The regional value is compared to the California state value.
US Value
(50.0%)
The regional value is compared to the national value.
Prior Value
(42.0%)
Prior Value compares a measured value with the previously measured value. Confidence intervals were not taken into account in determining the direction of the comparison.
Trend
This comparison measures the indicator’s values over multiple time periods.<br>The Mann-Kendall Test for Statistical Significance is used to evaluate the trend<br>over 4 to 10 periods of measure, subject to data availability and comparability.
County: Riverside Persons Fully Vaccinated Against COVID-19
County: Riverside Persons Fully Vaccinated Against COVID-19
61.7%
(May 10, 2023)
Compared to:
CA Counties
The distribution is based on data from 50 California counties.
U.S. Counties
The distribution is based on data from 3,125 U.S. counties and county equivalents.
Prior Value
(61.7%)
Prior Value compares a measured value with the previously measured value. Confidence intervals were not taken into account in determining the direction of the comparison.
Trend
This comparison measures the indicator’s values over multiple time periods.<br>The Mann-Kendall Test for Statistical Significance is used to evaluate the trend<br>over 4 to 10 periods of measure, subject to data availability and comparability.
County: Riverside Pneumonia Vaccinations: Medicare Population
County: Riverside Pneumonia Vaccinations: Medicare Population
8.0%
(2022)
Compared to:

CA Counties
The distribution is based on data from 58 California counties.
U.S. Counties
The distribution is based on data from 3,129 U.S. counties and county equivalents.
CA Value
(8.0%)
The regional value is compared to the California state value.
US Value
(8.0%)
The regional value is compared to the national value.
Prior Value
(5.0%)
Prior Value compares a measured value with the previously measured value. Confidence intervals were not taken into account in determining the direction of the comparison.
Trend
This comparison measures the indicator’s values over multiple time periods.<br>The Mann-Kendall Test for Statistical Significance is used to evaluate the trend<br>over 4 to 10 periods of measure, subject to data availability and comparability.
County: Riverside
Health / Maternal, Fetal & Infant Health
Value
Compared to:
County: Riverside Any In-Hospital Breastfeeding
County: Riverside Any In-Hospital Breastfeeding
92.2%
(2022)
Compared to:
CA Counties
The distribution is based on data from 58 California counties.
CA Value
(93.8%)
The regional value is compared to the California state value.
Prior Value
(91.2%)
Prior Value compares a measured value with the previously measured value. Confidence intervals were taken into account in determining the direction of the comparison.
Trend
This comparison measures the indicator’s values over multiple time periods.<br>The Mann-Kendall Test for Statistical Significance is used to evaluate the trend<br>over 4 to 10 periods of measure, subject to data availability and comparability.
County: Riverside In-Hospital Exclusive Breastfeeding
County: Riverside In-Hospital Exclusive Breastfeeding
66.8%
(2022)
Compared to:
CA Counties
The distribution is based on data from 58 California counties.
CA Value
(68.5%)
The regional value is compared to the California state value.
Prior Value
(65.0%)
Prior Value compares a measured value with the previously measured value. Confidence intervals were taken into account in determining the direction of the comparison.
Trend
This comparison measures the indicator’s values over multiple time periods.<br>The Mann-Kendall Test for Statistical Significance is used to evaluate the trend<br>over 4 to 10 periods of measure, subject to data availability and comparability.
County: Riverside Preterm Births
County: Riverside Preterm Births
9.0%
(2020-2022)
Compared to:
CA Counties
The distribution is based on data from 58 California counties.
CA Value
(9.0%)
The regional value is compared to the California state value.
Prior Value
(9.0%)
Prior Value compares a measured value with the previously measured value. Confidence intervals were taken into account in determining the direction of the comparison.
Trend
This comparison measures the indicator’s values over multiple time periods.<br>The Mann-Kendall Test for Statistical Significance is used to evaluate the trend<br>over 4 to 10 periods of measure, subject to data availability and comparability.
HP 2030 Target
(9.4%)
County: Riverside
Health / Mental Health & Mental Disorders
Value
Compared to:
County: Riverside Adults Needing and Receiving Behavioral Health Care Services
County: Riverside Adults Needing and Receiving Behavioral Health Care Services
52.3%
(2021-2022)
Compared to:
CA Counties
The distribution is based on data from 58 California counties.
CA Value
(55.9%)
The regional value is compared to the California state value.
Prior Value
(53.9%)
Prior Value compares a measured value with the previously measured value. Confidence intervals were taken into account in determining the direction of the comparison.
Trend
This comparison measures the indicator’s values over multiple time periods.<br>The Mann-Kendall Test for Statistical Significance is used to evaluate the trend<br>over 4 to 10 periods of measure, subject to data availability and comparability.
County: Riverside Adults Who Ever Thought Seriously About Committing Suicide
County: Riverside Adults Who Ever Thought Seriously About Committing Suicide
21.5%
(2021-2022)
Compared to:
CA Counties
The distribution is based on data from 58 California counties.
CA Value
(19.0%)
The regional value is compared to the California state value.
Prior Value
(17.1%)
Prior Value compares a measured value with the previously measured value. Confidence intervals were taken into account in determining the direction of the comparison.
Trend
This comparison measures the indicator’s values over multiple time periods.<br>The Mann-Kendall Test for Statistical Significance is used to evaluate the trend<br>over 4 to 10 periods of measure, subject to data availability and comparability.
County: Riverside Adults with Likely Serious Psychological Distress
County: Riverside Adults with Likely Serious Psychological Distress
14.4%
(2021-2022)
Compared to:
CA Counties
The distribution is based on data from 58 California counties.
CA Value
(16.7%)
The regional value is compared to the California state value.
Prior Value
(15.0%)
Prior Value compares a measured value with the previously measured value. Confidence intervals were taken into account in determining the direction of the comparison.
Trend
This comparison measures the indicator’s values over multiple time periods.<br>The Mann-Kendall Test for Statistical Significance is used to evaluate the trend<br>over 4 to 10 periods of measure, subject to data availability and comparability.
County: Riverside Depression: Medicare Population
County: Riverside Depression: Medicare Population
15.0%
(2022)
Compared to:
CA Counties
The distribution is based on data from 58 California counties.
U.S. Counties
The distribution is based on data from 3,129 U.S. counties and county equivalents.
CA Value
(14.0%)
The regional value is compared to the California state value.
US Value
(16.0%)
The regional value is compared to the national value.
Prior Value
(15.0%)
Prior Value compares a measured value with the previously measured value. Confidence intervals were not taken into account in determining the direction of the comparison.
Trend
This comparison measures the indicator’s values over multiple time periods.<br>The Mann-Kendall Test for Statistical Significance is used to evaluate the trend<br>over 4 to 10 periods of measure, subject to data availability and comparability.
County: Riverside
Health / Mortality Data
Value
Compared to:
County: Riverside Life Expectancy
County: Riverside Life Expectancy
78.5
Years
(2019-2021)
Compared to:
CA Counties
The distribution is based on data from 57 California counties.
U.S. Counties
The distribution is based on data from 3,070 U.S. counties and county equivalents.
CA Value
(79.9)
The regional value is compared to the California state value.
US Value
(77.6)
The regional value is compared to the national value.
County: Riverside
Health / Nutrition & Healthy Eating
Value
Compared to:
County: Riverside Adult Fast Food Consumption
County: Riverside Adult Fast Food Consumption
72.4%
(2016)
Compared to:
CA Counties
The distribution is based on data from 58 California counties.
CA Value
(65.6%)
The regional value is compared to the California state value.
Prior Value
(74.7%)
Prior Value compares a measured value with the previously measured value. Confidence intervals were taken into account in determining the direction of the comparison.
Trend
This comparison measures the indicator’s values over multiple time periods.<br>The Mann-Kendall Test for Statistical Significance is used to evaluate the trend<br>over 4 to 10 periods of measure, subject to data availability and comparability.
County: Riverside Child and Teen Fruit Consumption
County: Riverside Child and Teen Fruit Consumption
70.9%
(2019-2020)
Compared to:
CA Counties
The distribution is based on data from 58 California counties.
CA Value
(69.8%)
The regional value is compared to the California state value.
Prior Value
(67.9%)
Prior Value compares a measured value with the previously measured value. Confidence intervals were taken into account in determining the direction of the comparison.
Trend
This comparison measures the indicator’s values over multiple time periods.<br>The Mann-Kendall Test for Statistical Significance is used to evaluate the trend<br>over 4 to 10 periods of measure, subject to data availability and comparability.
County: Riverside
Health / Older Adults
Value
Compared to:
County: Riverside Adults 65+ with a Disability
County: Riverside Adults 65+ with a Disability
35.2%
(2018-2022)
Compared to:
CA Value
(33.5%)
The regional value is compared to the California state value.
US Value
(33.3%)
The regional value is compared to the national value.
Trend
This comparison measures the indicator’s values over multiple time periods.<br>The Mann-Kendall Test for Statistical Significance is used to evaluate the trend<br>over 4 to 10 periods of measure, subject to data availability and comparability.
County: Riverside Adults 65+ with a Hearing Difficulty
County: Riverside Adults 65+ with a Hearing Difficulty
14.0%
(2018-2022)
Compared to:

CA Value
(12.9%)
The regional value is compared to the California state value.
US Value
(13.7%)
The regional value is compared to the national value.
Trend
This comparison measures the indicator’s values over multiple time periods.<br>The Mann-Kendall Test for Statistical Significance is used to evaluate the trend<br>over 4 to 10 periods of measure, subject to data availability and comparability.
County: Riverside Adults 65+ with a Self-Care Difficulty
County: Riverside Adults 65+ with a Self-Care Difficulty
8.7%
(2018-2022)
Compared to:
CA Value
(9.5%)
The regional value is compared to the California state value.
US Value
(7.4%)
The regional value is compared to the national value.
Trend
This comparison measures the indicator’s values over multiple time periods.<br>The Mann-Kendall Test for Statistical Significance is used to evaluate the trend<br>over 4 to 10 periods of measure, subject to data availability and comparability.
County: Riverside Adults 65+ with a Vision Difficulty
County: Riverside Adults 65+ with a Vision Difficulty
6.4%
(2018-2022)
Compared to:
CA Value
(6.1%)
The regional value is compared to the California state value.
US Value
(6.0%)
The regional value is compared to the national value.
Trend
This comparison measures the indicator’s values over multiple time periods.<br>The Mann-Kendall Test for Statistical Significance is used to evaluate the trend<br>over 4 to 10 periods of measure, subject to data availability and comparability.
County: Riverside Adults 65+ with an Independent Living Difficulty
County: Riverside Adults 65+ with an Independent Living Difficulty
15.5%
(2018-2022)
Compared to:
CA Value
(16.4%)
The regional value is compared to the California state value.
US Value
(13.6%)
The regional value is compared to the national value.
Trend
This comparison measures the indicator’s values over multiple time periods.<br>The Mann-Kendall Test for Statistical Significance is used to evaluate the trend<br>over 4 to 10 periods of measure, subject to data availability and comparability.
County: Riverside Alzheimer's Disease or Dementia: Medicare Population
County: Riverside Alzheimer's Disease or Dementia: Medicare Population
5.0%
(2022)
Compared to:
CA Counties
The distribution is based on data from 58 California counties.
U.S. Counties
The distribution is based on data from 3,129 U.S. counties and county equivalents.
CA Value
(5.0%)
The regional value is compared to the California state value.
US Value
(6.0%)
The regional value is compared to the national value.
Prior Value
(5.0%)
Prior Value compares a measured value with the previously measured value. Confidence intervals were not taken into account in determining the direction of the comparison.
Trend
This comparison measures the indicator’s values over multiple time periods.<br>The Mann-Kendall Test for Statistical Significance is used to evaluate the trend<br>over 4 to 10 periods of measure, subject to data availability and comparability.
County: Riverside
Health / Other Conditions
Value
Compared to:
County: Riverside Chronic Kidney Disease: Medicare Population
County: Riverside Chronic Kidney Disease: Medicare Population
19.0%
(2022)
Compared to:
CA Counties
The distribution is based on data from 58 California counties.
U.S. Counties
The distribution is based on data from 3,129 U.S. counties and county equivalents.
CA Value
(16.0%)
The regional value is compared to the California state value.
US Value
(18.0%)
The regional value is compared to the national value.
Prior Value
(18.0%)
Prior Value compares a measured value with the previously measured value. Confidence intervals were not taken into account in determining the direction of the comparison.
Trend
This comparison measures the indicator’s values over multiple time periods.<br>The Mann-Kendall Test for Statistical Significance is used to evaluate the trend<br>over 4 to 10 periods of measure, subject to data availability and comparability.
County: Riverside Osteoporosis: Medicare Population
County: Riverside Osteoporosis: Medicare Population
12.0%
(2022)
Compared to:
CA Counties
The distribution is based on data from 58 California counties.
U.S. Counties
The distribution is based on data from 3,129 U.S. counties and county equivalents.
CA Value
(13.0%)
The regional value is compared to the California state value.
US Value
(11.0%)
The regional value is compared to the national value.
Prior Value
(12.0%)
Prior Value compares a measured value with the previously measured value. Confidence intervals were not taken into account in determining the direction of the comparison.
Trend
This comparison measures the indicator’s values over multiple time periods.<br>The Mann-Kendall Test for Statistical Significance is used to evaluate the trend<br>over 4 to 10 periods of measure, subject to data availability and comparability.
County: Riverside Rheumatoid Arthritis or Osteoarthritis: Medicare Population
County: Riverside Rheumatoid Arthritis or Osteoarthritis: Medicare Population
36.0%
(2022)
Compared to:
CA Counties
The distribution is based on data from 58 California counties.
U.S. Counties
The distribution is based on data from 3,129 U.S. counties and county equivalents.
CA Value
(32.0%)
The regional value is compared to the California state value.
US Value
(35.0%)
The regional value is compared to the national value.
Prior Value
(34.0%)
Prior Value compares a measured value with the previously measured value. Confidence intervals were not taken into account in determining the direction of the comparison.
Trend
This comparison measures the indicator’s values over multiple time periods.<br>The Mann-Kendall Test for Statistical Significance is used to evaluate the trend<br>over 4 to 10 periods of measure, subject to data availability and comparability.
County: Riverside
Health / Physical Activity
Value
Compared to:
County: Riverside 7th Grade Students who are Physically Fit
County: Riverside 7th Grade Students who are Physically Fit
57.8%
(2018-2019)
Compared to:

CA Counties
The distribution is based on data from 58 California counties.
CA Value
(61.0%)
The regional value is compared to the California state value.
Prior Value
(61.0%)
Prior Value compares a measured value with the previously measured value. Confidence intervals were not taken into account in determining the direction of the comparison.
Trend
This comparison measures the indicator’s values over multiple time periods.<br>The Mann-Kendall Test for Statistical Significance is used to evaluate the trend<br>over 4 to 10 periods of measure, subject to data availability and comparability.
County: Riverside Adults 20+ who are Sedentary
County: Riverside Adults 20+ who are Sedentary
17.9%
(2021)
Compared to:
CA Counties
The distribution is based on data from 58 California counties.
U.S. Counties
The distribution is based on data from 3,074 U.S. counties and county equivalents.
Prior Value
(18.6%)
Prior Value compares a measured value with the previously measured value. Confidence intervals were taken into account in determining the direction of the comparison.
Trend
This comparison measures the indicator’s values over multiple time periods.<br>The Mann-Kendall Test for Statistical Significance is used to evaluate the trend<br>over 4 to 10 periods of measure, subject to data availability and comparability.
County: Riverside Teens who Engage in Regular Physical Activity
County: Riverside Teens who Engage in Regular Physical Activity
50.1%
(2013-2014)
Compared to:
CA Counties
(2011-2012)
The distribution is based on data from 44 California counties and county groups.
CA Value
(69.6%)
The regional value is compared to the California state value.
Prior Value
(77.7%)
Prior Value compares a measured value with the previously measured value. Confidence intervals were taken into account in determining the direction of the comparison.
County: Riverside
Health / Prevention & Safety
Value
Compared to:
County: Riverside Age-Adjusted Death Rate due to Firearms
County: Riverside Age-Adjusted Death Rate due to Firearms
8.2
Deaths per 100,000 population
(2018-2020)
Compared to:
CA Counties
The distribution is based on data from 45 California counties.
U.S. Counties
The distribution is based on data from 1,083 U.S. counties and county equivalents.
CA Value
(7.4)
The regional value is compared to the California state value.
US Value
(12.0)
The regional value is compared to the national value.
Prior Value
(7.5)
Prior Value compares a measured value with the previously measured value. Confidence intervals were taken into account in determining the direction of the comparison.
Trend
This comparison measures the indicator’s values over multiple time periods.<br>The Mann-Kendall Test for Statistical Significance is used to evaluate the trend<br>over 4 to 10 periods of measure, subject to data availability and comparability.
HP 2030 Target
(10.7)
County: Riverside
Health / Respiratory Diseases
Value
Compared to:
County: Riverside Adults with Asthma
County: Riverside Adults with Asthma
16.1%
(2022)
Compared to:
CA Counties
The distribution is based on data from 58 California counties.
CA Value
(17.0%)
The regional value is compared to the California state value.
US Value
(15.7%)
The regional value is compared to the national value. The source for the national value is Behavioral Risk Factor Surveillance System
Prior Value
(14.8%)
Prior Value compares a measured value with the previously measured value. Confidence intervals were taken into account in determining the direction of the comparison.
Trend
This comparison measures the indicator’s values over multiple time periods.<br>The Mann-Kendall Test for Statistical Significance is used to evaluate the trend<br>over 4 to 10 periods of measure, subject to data availability and comparability.
County: Riverside Asthma: Medicare Population
County: Riverside Asthma: Medicare Population
6.0%
(2022)
Compared to:
CA Counties
The distribution is based on data from 58 California counties.
U.S. Counties
The distribution is based on data from 3,129 U.S. counties and county equivalents.
CA Value
(7.0%)
The regional value is compared to the California state value.
US Value
(7.0%)
The regional value is compared to the national value.
Prior Value
(6.0%)
Prior Value compares a measured value with the previously measured value. Confidence intervals were not taken into account in determining the direction of the comparison.
Trend
This comparison measures the indicator’s values over multiple time periods.<br>The Mann-Kendall Test for Statistical Significance is used to evaluate the trend<br>over 4 to 10 periods of measure, subject to data availability and comparability.
County: Riverside COPD: Medicare Population
County: Riverside COPD: Medicare Population
11.0%
(2022)
Compared to:
CA Counties
The distribution is based on data from 58 California counties.
U.S. Counties
The distribution is based on data from 3,129 U.S. counties and county equivalents.
CA Value
(8.0%)
The regional value is compared to the California state value.
US Value
(11.0%)
The regional value is compared to the national value.
Prior Value
(11.0%)
Prior Value compares a measured value with the previously measured value. Confidence intervals were not taken into account in determining the direction of the comparison.
Trend
This comparison measures the indicator’s values over multiple time periods.<br>The Mann-Kendall Test for Statistical Significance is used to evaluate the trend<br>over 4 to 10 periods of measure, subject to data availability and comparability.
County: Riverside
Health / Sexually Transmitted Infections
Value
Compared to:
County: Riverside Chlamydia Incidence Rate
County: Riverside Chlamydia Incidence Rate
494.3
Cases per 100,000 population
(2021)
Compared to:
CA Counties
The distribution is based on data from 58 California counties.
CA Value
(484.7)
The regional value is compared to the California state value.
US Value
(495.5)
The regional value is compared to the national value. The source for the national value is National Center for HIV/AIDS, Viral Hepatitis, STD, and TB Prevention
Prior Value
(436.9)
Prior Value compares a measured value with the previously measured value. Confidence intervals were not taken into account in determining the direction of the comparison.
Trend
This comparison measures the indicator’s values over multiple time periods.<br>The Mann-Kendall Test for Statistical Significance is used to evaluate the trend<br>over 4 to 10 periods of measure, subject to data availability and comparability.
County: Riverside Gonorrhea Incidence Rate
County: Riverside Gonorrhea Incidence Rate
203.8
Cases per 100,000 population
(2021)
Compared to:
CA Counties
The distribution is based on data from 58 California counties.
CA Value
(230.9)
The regional value is compared to the California state value.
US Value
(214.0)
The regional value is compared to the national value. The source for the national value is National Center for HIV/AIDS, Viral Hepatitis, STD, and TB Prevention
Prior Value
(158.3)
Prior Value compares a measured value with the previously measured value. Confidence intervals were not taken into account in determining the direction of the comparison.
Trend
This comparison measures the indicator’s values over multiple time periods.<br>The Mann-Kendall Test for Statistical Significance is used to evaluate the trend<br>over 4 to 10 periods of measure, subject to data availability and comparability.
County: Riverside Syphilis Incidence Rate
County: Riverside Syphilis Incidence Rate
16.6
Cases per 100,000 population
(2021)
Compared to:
CA Counties
The distribution is based on data from 58 California counties.
CA Value
(22.3)
The regional value is compared to the California state value.
US Value
(16.2)
The regional value is compared to the national value. The source for the national value is National Center for HIV/AIDS, Viral Hepatitis, STD, and TB Prevention
Prior Value
(19.0)
Prior Value compares a measured value with the previously measured value. Confidence intervals were not taken into account in determining the direction of the comparison.
Trend
This comparison measures the indicator’s values over multiple time periods.<br>The Mann-Kendall Test for Statistical Significance is used to evaluate the trend<br>over 4 to 10 periods of measure, subject to data availability and comparability.
County: Riverside
Health / Weight Status
Value
Compared to:
County: Riverside 5th Grade Students who are at a Healthy Weight or Underweight
County: Riverside 5th Grade Students who are at a Healthy Weight or Underweight
59.5%
(2018-2019)
Compared to:
CA Counties
The distribution is based on data from 58 California counties.
CA Value
(58.7%)
The regional value is compared to the California state value.
Prior Value
(60.0%)
Prior Value compares a measured value with the previously measured value. Confidence intervals were not taken into account in determining the direction of the comparison.
Trend
This comparison measures the indicator’s values over multiple time periods.<br>The Mann-Kendall Test for Statistical Significance is used to evaluate the trend<br>over 4 to 10 periods of measure, subject to data availability and comparability.
County: Riverside 9th Grade Students who are at a Healthy Weight or Underweight
County: Riverside 9th Grade Students who are at a Healthy Weight or Underweight
62.3%
(2018-2019)
Compared to:
CA Counties
The distribution is based on data from 58 California counties.
CA Value
(62.2%)
The regional value is compared to the California state value.
Prior Value
(61.9%)
Prior Value compares a measured value with the previously measured value. Confidence intervals were not taken into account in determining the direction of the comparison.
Trend
This comparison measures the indicator’s values over multiple time periods.<br>The Mann-Kendall Test for Statistical Significance is used to evaluate the trend<br>over 4 to 10 periods of measure, subject to data availability and comparability.
County: Riverside Adults Who Are Obese
County: Riverside Adults Who Are Obese
35.0%
(2022)
Compared to:
CA Counties
The distribution is based on data from 58 California counties.
CA Value
(28.8%)
The regional value is compared to the California state value.
US Value
(33.6%)
The regional value is compared to the national value. The source for the national value is Behavioral Risk Factor Surveillance System
Prior Value
(33.4%)
Prior Value compares a measured value with the previously measured value. Confidence intervals were taken into account in determining the direction of the comparison.
Trend
This comparison measures the indicator’s values over multiple time periods.<br>The Mann-Kendall Test for Statistical Significance is used to evaluate the trend<br>over 4 to 10 periods of measure, subject to data availability and comparability.
County: Riverside Adults who are Overweight or Obese
County: Riverside Adults who are Overweight or Obese
69.5%
(2022)
Compared to:
CA Counties
The distribution is based on data from 58 California counties.
CA Value
(62.3%)
The regional value is compared to the California state value.
US Value
(67.7%)
The regional value is compared to the national value. The source for the national value is Behavioral Risk Factor Surveillance System
Prior Value
(68.5%)
Prior Value compares a measured value with the previously measured value. Confidence intervals were taken into account in determining the direction of the comparison.
Trend
This comparison measures the indicator’s values over multiple time periods.<br>The Mann-Kendall Test for Statistical Significance is used to evaluate the trend<br>over 4 to 10 periods of measure, subject to data availability and comparability.
County: Riverside
Health / Wellness & Lifestyle
Value
Compared to:
County: Riverside Self-Reported General Health Assessment: Good or Better
County: Riverside Self-Reported General Health Assessment: Good or Better
88.6%
(2022)
Compared to:
CA Counties
The distribution is based on data from 58 California counties.
CA Value
(86.0%)
The regional value is compared to the California state value.
Prior Value
(86.4%)
Prior Value compares a measured value with the previously measured value. Confidence intervals were taken into account in determining the direction of the comparison.
Trend
This comparison measures the indicator’s values over multiple time periods.<br>The Mann-Kendall Test for Statistical Significance is used to evaluate the trend<br>over 4 to 10 periods of measure, subject to data availability and comparability.
County: Riverside
Community / Civic Engagement
Value
Compared to:
County: Riverside Voter Engagement
County: Riverside Voter Engagement
60.7%
Percent of adults
(2022)
Compared to:
CA Counties
The distribution is based on data from 58 California counties.
CA Value
(66.2%)
The regional value is compared to the California state value.
Prior Value
(65.8%)
Prior Value compares a measured value with the previously measured value. Confidence intervals were taken into account in determining the direction of the comparison.
Trend
This comparison measures the indicator’s values over multiple time periods.<br>The Mann-Kendall Test for Statistical Significance is used to evaluate the trend<br>over 4 to 10 periods of measure, subject to data availability and comparability.
County: Riverside
Community / Crime & Crime Prevention
Value
Compared to:
County: Riverside Age-Adjusted Death Rate due to Homicide
County: Riverside Age-Adjusted Death Rate due to Homicide
5.3
Deaths per 100,000 population
(2018-2020)
Compared to:
CA Counties
The distribution is based on data from 32 California counties.
U.S. Counties
The distribution is based on data from 495 U.S. counties and county equivalents.
CA Value
(5.1)
The regional value is compared to the California state value.
US Value
(6.6)
The regional value is compared to the national value.
Prior Value
(4.8)
Prior Value compares a measured value with the previously measured value. Confidence intervals were taken into account in determining the direction of the comparison.
Trend
This comparison measures the indicator’s values over multiple time periods.<br>The Mann-Kendall Test for Statistical Significance is used to evaluate the trend<br>over 4 to 10 periods of measure, subject to data availability and comparability.
HP 2030 Target
(5.5)
<div>IVP-09: Reduce homicides <strong>(LEADING HEALTH INDICATOR)</strong></div>
County: Riverside
Community / Demographics
Value
Compared to:
County: Riverside Foreign Born Persons
County: Riverside Foreign Born Persons
21.7%
(2018-2022)
Compared to:
CA Value
(26.5%)
The regional value is compared to the California state value.
US Value
(13.7%)
The regional value is compared to the national value.
Trend
This comparison measures the indicator’s values over multiple time periods.<br>The Mann-Kendall Test for Statistical Significance is used to evaluate the trend<br>over 4 to 10 periods of measure, subject to data availability and comparability.
County: Riverside Veteran Population
County: Riverside Veteran Population
6.1%
(2018-2022)
Compared to:
CA Value
(4.7%)
The regional value is compared to the California state value.
US Value
(6.6%)
The regional value is compared to the national value.
Trend
This comparison measures the indicator’s values over multiple time periods.<br>The Mann-Kendall Test for Statistical Significance is used to evaluate the trend<br>over 4 to 10 periods of measure, subject to data availability and comparability.
County: Riverside
Community / Social Environment
Value
Compared to:
County: Riverside Substantiated Child Abuse Rate
County: Riverside Substantiated Child Abuse Rate
9.4
Cases per 1,000 children
(2022)
Compared to:
CA Value
(6.1)
The regional value is compared to the California state value.
US Value
(8.2 in 2021)
The regional value is compared to the national value. The source for the national value is Children's Bureau
Prior Value
(9.3)
Prior Value compares a measured value with the previously measured value. Confidence intervals were not taken into account in determining the direction of the comparison.
Trend
This comparison measures the indicator’s values over multiple time periods.<br>The Mann-Kendall Test for Statistical Significance is used to evaluate the trend<br>over 4 to 10 periods of measure, subject to data availability and comparability.
HP 2030 Target
(8.7)
County: Riverside
Community / Transportation
Value
Compared to:
County: Riverside Mean Travel Time to Work
County: Riverside Mean Travel Time to Work
33.8
Minutes
(2018-2022)
Compared to:
CA Counties
The distribution is based on data from 58 California counties.
U.S. Counties
The distribution is based on data from 3,131 U.S. counties and county equivalents.
CA Value
(29.2)
The regional value is compared to the California state value.
US Value
(26.7)
The regional value is compared to the national value.
Trend
This comparison measures the indicator’s values over multiple time periods.<br>The Mann-Kendall Test for Statistical Significance is used to evaluate the trend<br>over 4 to 10 periods of measure, subject to data availability and comparability.
County: Riverside Workers Commuting by Public Transportation
County: Riverside Workers Commuting by Public Transportation
0.8%
(2018-2022)
Compared to:
CA Counties
The distribution is based on data from 58 California counties.
U.S. Counties
(2015-2019)
The distribution is based on data from 3,142 U.S. counties and county equivalents.
CA Value
(3.6%)
The regional value is compared to the California state value.
US Value
(3.8%)
The regional value is compared to the national value.
Trend
This comparison measures the indicator’s values over multiple time periods.<br>The Mann-Kendall Test for Statistical Significance is used to evaluate the trend<br>over 4 to 10 periods of measure, subject to data availability and comparability.
HP 2030 Target
(5.3%)
County: Riverside Workers who Drive Alone to Work
County: Riverside Workers who Drive Alone to Work
75.9%
(2018-2022)
Compared to:
CA Counties
The distribution is based on data from 58 California counties.
U.S. Counties
The distribution is based on data from 3,133 U.S. counties and county equivalents.
CA Value
(68.4%)
The regional value is compared to the California state value.
US Value
(71.7%)
The regional value is compared to the national value.
Trend
This comparison measures the indicator’s values over multiple time periods.<br>The Mann-Kendall Test for Statistical Significance is used to evaluate the trend<br>over 4 to 10 periods of measure, subject to data availability and comparability.
County: Riverside Workers who Walk to Work
County: Riverside Workers who Walk to Work
1.2%
(2018-2022)
Compared to:
CA Counties
The distribution is based on data from 58 California counties.
U.S. Counties
The distribution is based on data from 3,133 U.S. counties and county equivalents.
CA Value
(2.4%)
The regional value is compared to the California state value.
US Value
(2.4%)
The regional value is compared to the national value.
Trend
This comparison measures the indicator’s values over multiple time periods.<br>The Mann-Kendall Test for Statistical Significance is used to evaluate the trend<br>over 4 to 10 periods of measure, subject to data availability and comparability.
County: Riverside
Economy / Food Insecurity
Value
Compared to:
County: Riverside Adults Receiving Food Stamp Benefits
County: Riverside Adults Receiving Food Stamp Benefits
23.1%
(2022)
Compared to:
CA Counties
The distribution is based on data from 58 California counties.
CA Value
(31.7%)
The regional value is compared to the California state value.
Prior Value
(26.6%)
Prior Value compares a measured value with the previously measured value. Confidence intervals were taken into account in determining the direction of the comparison.
Trend
This comparison measures the indicator’s values over multiple time periods.<br>The Mann-Kendall Test for Statistical Significance is used to evaluate the trend<br>over 4 to 10 periods of measure, subject to data availability and comparability.
County: Riverside
Economy / Housing & Homes
Value
Compared to:
County: Riverside Overcrowded Households
County: Riverside Overcrowded Households
7.4%
(2018-2022)
Compared to:
CA Counties
The distribution is based on data from 58 California counties.
CA Value
(8.2%)
The regional value is compared to the California state value.
US Value
(3.4%)
The regional value is compared to the national value.
Trend
This comparison measures the indicator’s values over multiple time periods.<br>The Mann-Kendall Test for Statistical Significance is used to evaluate the trend<br>over 4 to 10 periods of measure, subject to data availability and comparability.
County: Riverside Renters Spending 30% or More of Household Income on Rent
County: Riverside Renters Spending 30% or More of Household Income on Rent
58.4%
(2018-2022)
Compared to:
CA Counties
The distribution is based on data from 58 California counties.
U.S. Counties
The distribution is based on data from 3,132 U.S. counties and county equivalents.
CA Value
(54.4%)
The regional value is compared to the California state value.
US Value
(49.9%)
The regional value is compared to the national value.
Trend
This comparison measures the indicator’s values over multiple time periods.<br>The Mann-Kendall Test for Statistical Significance is used to evaluate the trend<br>over 4 to 10 periods of measure, subject to data availability and comparability.
HP 2030 Target
(25.5%)
County: Riverside
Economy / Income
Value
Compared to:
County: Riverside Households Below the Real Cost Measure
County: Riverside Households Below the Real Cost Measure
34.0%
(2021)
Compared to:
CA Counties
The distribution is based on data from 34 California counties.
CA Value
(34.0%)
The regional value is compared to the California state value.
County: Riverside Median Household Income
County: Riverside Median Household Income
$84,505
(2018-2022)
Compared to:
CA Counties
The distribution is based on data from 58 California counties.
U.S. Counties
The distribution is based on data from 3,132 U.S. counties and county equivalents.
CA Value
($91,905)
The regional value is compared to the California state value.
US Value
($75,149)
The regional value is compared to the national value.
Trend
This comparison measures the indicator’s values over multiple time periods.<br>The Mann-Kendall Test for Statistical Significance is used to evaluate the trend<br>over 4 to 10 periods of measure, subject to data availability and comparability.
County: Riverside Per Capita Income
County: Riverside Per Capita Income
$35,356
(2018-2022)
Compared to:
CA Counties
The distribution is based on data from 58 California counties.
U.S. Counties
The distribution is based on data from 3,133 U.S. counties and county equivalents.
CA Value
($45,591)
The regional value is compared to the California state value.
US Value
($41,261)
The regional value is compared to the national value.
Trend
This comparison measures the indicator’s values over multiple time periods.<br>The Mann-Kendall Test for Statistical Significance is used to evaluate the trend<br>over 4 to 10 periods of measure, subject to data availability and comparability.
County: Riverside
Economy / Poverty
Value
Compared to:
County: Riverside Children Living Below Poverty Level
County: Riverside Children Living Below Poverty Level
14.8%
(2018-2022)
Compared to:
CA Counties
The distribution is based on data from 58 California counties.
U.S. Counties
The distribution is based on data from 3,132 U.S. counties and county equivalents.
CA Value
(15.6%)
The regional value is compared to the California state value.
US Value
(16.7%)
The regional value is compared to the national value.
Trend
This comparison measures the indicator’s values over multiple time periods.<br>The Mann-Kendall Test for Statistical Significance is used to evaluate the trend<br>over 4 to 10 periods of measure, subject to data availability and comparability.
County: Riverside Families Living Below Poverty Level
County: Riverside Families Living Below Poverty Level
8.6%
(2018-2022)
Compared to:
CA Counties
The distribution is based on data from 58 California counties.
U.S. Counties
The distribution is based on data from 3,104 U.S. counties and county equivalents.
CA Value
(8.5%)
The regional value is compared to the California state value.
US Value
(8.8%)
The regional value is compared to the national value.
Trend
This comparison measures the indicator’s values over multiple time periods.<br>The Mann-Kendall Test for Statistical Significance is used to evaluate the trend<br>over 4 to 10 periods of measure, subject to data availability and comparability.
County: Riverside People 65+ Living Below Poverty Level
County: Riverside People 65+ Living Below Poverty Level
10.3%
(2018-2022)
Compared to:
CA Counties
The distribution is based on data from 58 California counties.
U.S. Counties
The distribution is based on data from 3,133 U.S. counties and county equivalents.
CA Value
(11.0%)
The regional value is compared to the California state value.
US Value
(10.0%)
The regional value is compared to the national value.
Trend
This comparison measures the indicator’s values over multiple time periods.<br>The Mann-Kendall Test for Statistical Significance is used to evaluate the trend<br>over 4 to 10 periods of measure, subject to data availability and comparability.
County: Riverside People 65+ Living Below Poverty Level (Count)
County: Riverside People 65+ Living Below Poverty Level (Count)
36,733
People
(2018-2022)
Compared to:
Trend
This comparison measures the indicator’s values over multiple time periods.<br>The Mann-Kendall Test for Statistical Significance is used to evaluate the trend<br>over 4 to 10 periods of measure, subject to data availability and comparability.
County: Riverside People Living Below Poverty Level
County: Riverside People Living Below Poverty Level
11.4%
(2018-2022)
Compared to:
CA Counties
The distribution is based on data from 58 California counties.
U.S. Counties
The distribution is based on data from 3,133 U.S. counties and county equivalents.
CA Value
(12.1%)
The regional value is compared to the California state value.
US Value
(12.5%)
The regional value is compared to the national value.
Trend
This comparison measures the indicator’s values over multiple time periods.<br>The Mann-Kendall Test for Statistical Significance is used to evaluate the trend<br>over 4 to 10 periods of measure, subject to data availability and comparability.
HP 2030 Target
(8.0%)
County: Riverside Youth not in School or Working
County: Riverside Youth not in School or Working
2.2%
(2018-2022)
Compared to:
CA Counties
The distribution is based on data from 58 California counties.
U.S. Counties
The distribution is based on data from 3,130 U.S. counties and county equivalents.
CA Value
(1.5%)
The regional value is compared to the California state value.
US Value
(1.8%)
The regional value is compared to the national value.
Trend
This comparison measures the indicator’s values over multiple time periods.<br>The Mann-Kendall Test for Statistical Significance is used to evaluate the trend<br>over 4 to 10 periods of measure, subject to data availability and comparability.
County: Riverside
Education / Educational Attainment
Value
Compared to:
County: Riverside People 25+ with a Bachelor's Degree or Higher
County: Riverside People 25+ with a Bachelor's Degree or Higher
24.1%
(2018-2022)
Compared to:
CA Counties
The distribution is based on data from 58 California counties.
U.S. Counties
The distribution is based on data from 3,133 U.S. counties and county equivalents.
CA Value
(35.9%)
The regional value is compared to the California state value.
US Value
(34.3%)
The regional value is compared to the national value.
Trend
This comparison measures the indicator’s values over multiple time periods.<br>The Mann-Kendall Test for Statistical Significance is used to evaluate the trend<br>over 4 to 10 periods of measure, subject to data availability and comparability.
County: Riverside People 25+ with a High School Diploma or Higher
County: Riverside People 25+ with a High School Diploma or Higher
83.1%
(2018-2022)
Compared to:
CA Counties
The distribution is based on data from 58 California counties.
U.S. Counties
The distribution is based on data from 3,133 U.S. counties and county equivalents.
CA Value
(84.4%)
The regional value is compared to the California state value.
US Value
(89.1%)
The regional value is compared to the national value.
Trend
This comparison measures the indicator’s values over multiple time periods.<br>The Mann-Kendall Test for Statistical Significance is used to evaluate the trend<br>over 4 to 10 periods of measure, subject to data availability and comparability.
County: Riverside
Environmental Health / Built Environment
Value
Compared to:
County: Riverside Access to Parks
County: Riverside Access to Parks
65.7%
(2020)
Compared to:
CA Counties
The distribution is based on data from 58 California counties.
CA Value
(82.4%)
The regional value is compared to the California state value.
Prior Value
(60.4%)
Prior Value compares a measured value with the previously measured value. Confidence intervals were not taken into account in determining the direction of the comparison.
