
Indicator Gauge Icon Legend
Legend Colors
Red is bad, green is good, blue is not statistically different/neutral.
Compared to Distribution
 the value is in the best half of communities.
 the value is in the 2nd worst quarter of communities.
 the value is in the worst quarter of communities.
Compared to Target
 meets target;
  does not meet target.
Compared to a Single Value
 lower than the comparison value;
 higher than the comparison value;
 not statistically different from comparison value.
Trend

 non-significant change over time;
 significant change over time;
  no change over time.
Compared to Prior Value
 higher than the previous measurement period;
 lower than the previous measurement period;
 no statistically different change from previous measurement period.
 Significantly better than the overall value
 Significantly worse than the overall value
 No significant difference with the overall value
 No data on significance available
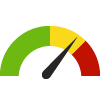
Age-Adjusted Death Rate due to All Opioid Overdose
Measurement Period: 2022
This indicator is archived and is no longer being updated. Click to learn more
This indicator shows the age-adjusted death rate due to all opioid-related overdoses per 100,000 residents. This includes acute poisoning deaths due to opioids such as prescription opioid pain relievers (e.g. hydrocodone, oxycodone, and morphine), heroin, and opium. Deaths related to chronic use of drugs are excluded from this indicator.
Why is this important?
Opioids are natural or synthetic chemicals that bind to receptors in your brain or body. Common opioids include heroin and prescription drugs such as oxycodone, hydrocodone, and fentanyl. Opioid abuse is a serious public health issue, but preventive actions, limiting the number of opioid prescriptions, and treatment for addiction to prevent future use can help.
The majority of drug overdose deaths involve an opioid, and at least half of all opioid overdose deaths involve a prescription opioid. Since 1999, the rate of overdose deaths involving opioids (including prescription opioid pain relievers) has nearly quadrupled. According to the CDC, overdoses from prescription opioid pain relievers are a driving factor in the increase in opioid overdose deaths.
23.6
Rate per 100,000 residents
Source:
California Opioid Overdose Surveillance Dashboard
Measurement period: 2022
Maintained by: Conduent Healthy Communities Institute
Last update: March 2024
Measurement period: 2022
Maintained by: Conduent Healthy Communities Institute
Last update: March 2024
Compared to


More details:
For more information on data with missing confidence intervals, see CDPH Technical Notes: https://skylab.cdph.ca.gov/ODdash/
Graph Selections

Data Source
- California Opioid Overdose Surveillance Dashboard
Maintained By: Conduent Healthy Communities Institute (Methodology)
Filed under: Health / Alcohol & Drug Use, Health Outcomes