
Indicator Gauge Icon Legend
Legend Colors
Red is bad, green is good, blue is not statistically different/neutral.
Compared to Distribution
 the value is in the best half of communities.
 the value is in the 2nd worst quarter of communities.
 the value is in the worst quarter of communities.
Compared to Target
 meets target;
  does not meet target.
Compared to a Single Value
 lower than the comparison value;
 higher than the comparison value;
 not statistically different from comparison value.
Trend

 non-significant change over time;
 significant change over time;
  no change over time.
Compared to Prior Value
 higher than the previous measurement period;
 lower than the previous measurement period;
 no statistically different change from previous measurement period.
 Significantly better than the overall value
 Significantly worse than the overall value
 No significant difference with the overall value
 No data on significance available
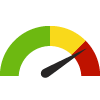
Adults 65+ with Total Tooth Loss
Census Place (City): Desert Hot Springs
Measurement Period: 2020
This indicator is archived and is no longer being updated. Click to learn more
This indicator shows the percentage of adults aged 65 and older who have had all of their natural teeth extracted.
Why is this important?
Oral health has been shown to impact overall health and well-being. According to the Centers for Disease Control and Prevention, nearly one-third of all adults in the United States have untreated tooth decay, or tooth caries. Additionally, one in seven adults aged 35 to 44 years old has periodontal (gum) disease. Both the severity and prevalence of periodontal disease increase with age. Periodontal disease and tooth decay are the most frequent causes of tooth loss. About 25% of adults over the age of 60 no longer have any natural teeth. Having missing teeth can affect overall health and nutrition. In addition, among those aged 65 and older, those in poverty are twice as likely as those with higher incomes to have lost all of their teeth. Given these serious health consequences, it is important to maintain good oral health.
Clear this location
Census Place (City): Desert Hot Springs
19.5%
Source:
CDC - PLACES
Measurement period: 2020
Maintained by: Conduent Healthy Communities Institute
Last update: September 2023
Measurement period: 2020
Maintained by: Conduent Healthy Communities Institute
Last update: September 2023
Compared to

Technical note: Sub-county small area estimates use state and county data from the CDC's Behavioral Risk Factor Surveillance System (BRFSS) in tandem with demographic data for census tracts and cities. It is not appropriate to use this data for evaluation purposes.Census 2010 population counts and geographic boundaries data were used because corresponding Census 2020 population data are not available.
More details:
Graph Selections

| Census Place (City) | Source | Measurement Period | Percent | |
|---|---|---|---|---|
There are 72 Census Place (City) values. The lowest value is 7.1%, and the highest value is 30.2%.
Half of the values are between 10.9% and 17.3%.
The middle (median) value is 13.8%.
Data Source
- CDC - PLACES
Note: This source uses Zip Code Tabulation Areas (ZCTAs) for its Zip Code data. Learn more
Maintained By: Conduent Healthy Communities Institute (Methodology)
Filed under: Health / Oral Health, Health / Older Adults, Health Outcomes, Older Adults